By Daniel Kapavik
Project Manager
When schools or non-profit organizations come to Measuring Success for survey work, they often don’t know exactly which questions need to be answered. Maybe they’ve seen our data visualization dashboards, or heard through word-of-mouth, about our experience and expertise in conducting surveys and presenting actionable business intelligence. They know they need answers to improve their current state, they just aren’t sure which answers will have the biggest impact.
From the perspective of a project manager, creating a survey on the front end that will allow us to visualize the data for the client in a way that is easy to understand and use is critical.
Cross tabs allow users to look at two variables at once.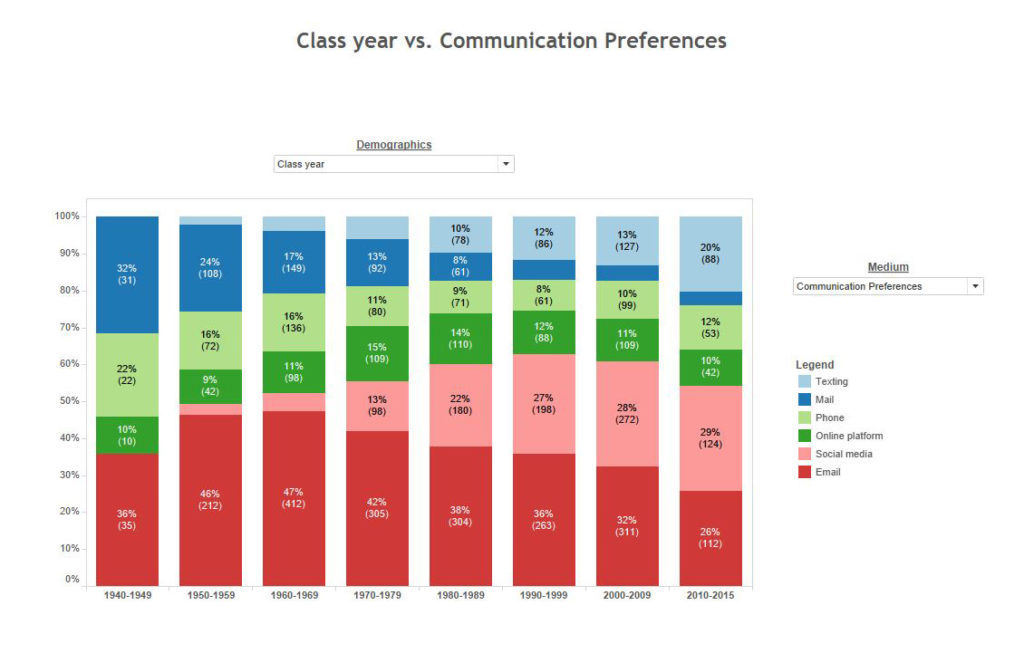
We know that coming up with survey questions seems straightforward. Many schools try a “do-it-yourself” approach before deciding to get professional help. Obviously, the first step is asking the questions you want to see answered.
But, there is more to a good survey than drawing a straight line from a question to an answer. It’s important to be able to see trends; to be able to look at the way different groups of people answer the same question.
Psychometric experts — those in the field who seek to objectively measure and validate skills and knowledge, abilities, attitudes, and achievement — they’re always trying to get better answers. In the era of big data, these experts have a new set of tools readily available. The outcome is the deployment of surveys and the representations of the answers that are more powerful than ever before (and it is only going to continue to improve).
When Measuring Success first got started, we used to present clients with two things at the end of a consultation: a very large Excel spreadsheet with all the answers to the survey queries, and a very long PowerPoint presentation that analyzed the data. Clients clicked through the slides, one-by-one, to be fed the insights we wanted them to have.
A few years ago, we switched to giving clients a business visualization dashboard – it is a deliverable that presents the outcome in a way that even a first-time user can master in a matter of minutes.
These dashboards are dynamic, so the end-user has the opportunity to look at the results they most want to see. They can cross-cut the data to look at two variables at once. For example, in a parent satisfaction survey, they may want to look at the strength of the academic program by grade, or by families who have more than one student enrolled, or by students who participate in extracurricular activities. They may want to benchmark the responses of their school against peer schools. They have the option of seeing patterns and trends based on a variety of factors — factors that the end user chooses.
Sometimes spending time with a dashboard can be a little like going to a Wikipedia page. You think you want to learn a little about one item. A half an hour later, you’ve clicked through a number of links and arrived at some information that you didn’t really know you wanted to know (but now that you know it, it’s a “lightbulb above your head” moment).

Some of this requires a good history of having conducted surveys in the past. We’ve learned that some questions don’t work well in a visualization. For example, multi checkboxes are difficult to represent visually. You can’t visualize all the combinations (and sometimes need to create a separate dashboard just for those responses).
Limiting responses to one question and one answer are best for seeing correlations and outcomes.
These answers don’t need to be limited to just a couple of answer types. You can ask for numerical rankings, perceptions based on the Likert scale, limited multiple choice answers, etc.
Another great thing about the dashboards we create is the ability to look for data and information outside of the survey responses we collect on behalf of our clients.
We can combine demographic data, or combine our survey with additional data collected from a school (maybe a past survey or other information they have on hand).
What is key over the course of a number of surveys (year-over-year) is to look for trends. Patterns can inform where you are getting things right and where things are beginning to take a negative turn that impacts perceived value. This is the type of business intelligence that can make all the difference in better meeting the needs of your families, sustaining your operation or improving your mission.
